

Muddy data is the bane of any analyst's existence. There's nothing more frustrating than discovering your traffic collection is wrong and you're going to have to start all over again.
Years of data can be thrown out in an instant, but if you take the time to regularly check some basic configuration steps now, future you will thank you for it. Follow this guide to help diagnose common issues in Google Analytics
Diagnosis 1: Duplicate GA Script
.gif)
One of the most common tracking issues is having two Google Analytics Scripts installed on a website. This is common when you have, at some point, installed Google Analytics (GA) and decided later to use Google Tag Manager (GTM). Luckily, this is an easy problem to diagnose and fix.
Symptoms:
- Bounce rate appears as 0% or close to it.
- Sessions are double the amount of users.
- Page views are much higher than expected.
How to cure:
- If you're using GTM, remove any GA snippet that lives outside it.
- If you're not using GTM, check the GA Snippet information in your account and keep the more accurate / recent one.
Diagnosis 2: Internal traffic is not excluded

This is the one of those cases where prevention is better than a cure. If you're an online business with at least one employee, chances are you're going to be looking at your website... a lot.
This can trigger event and page view goals that reduce the clarity of the data you're looking at.
In extreme cases, you may have a development team working in an environment that generates unique user counts every time the website is loaded. Because session data is wiped in development environments (devs don't like cookies), GA thinks that's a new user every. single. time.
Symptoms:
On the surface everything can look okay. Usually a give away is...
- Lower than expected conversion rates.
- Session and user data don't line up with CMS tools such as HubSpot or Wordpress.
How to cure:
1. Set up IP Filtering
One of the first steps when setting up a new account is to add IP filtering to the view level. To do this...
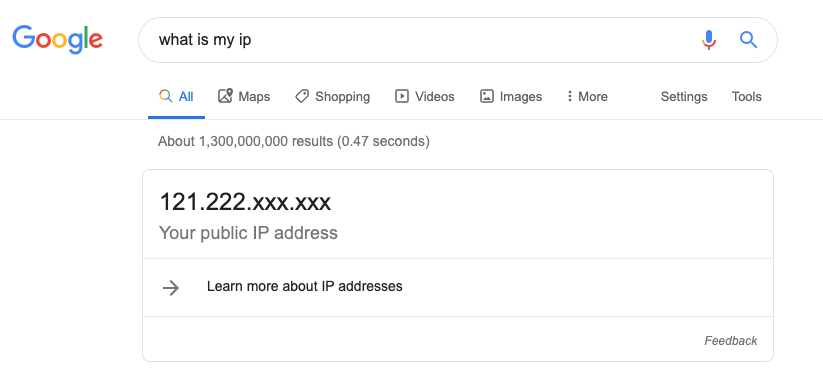
Go to Google and type "What is my IP"
Go to your Analytics account - Admin > Filters > Add Filter
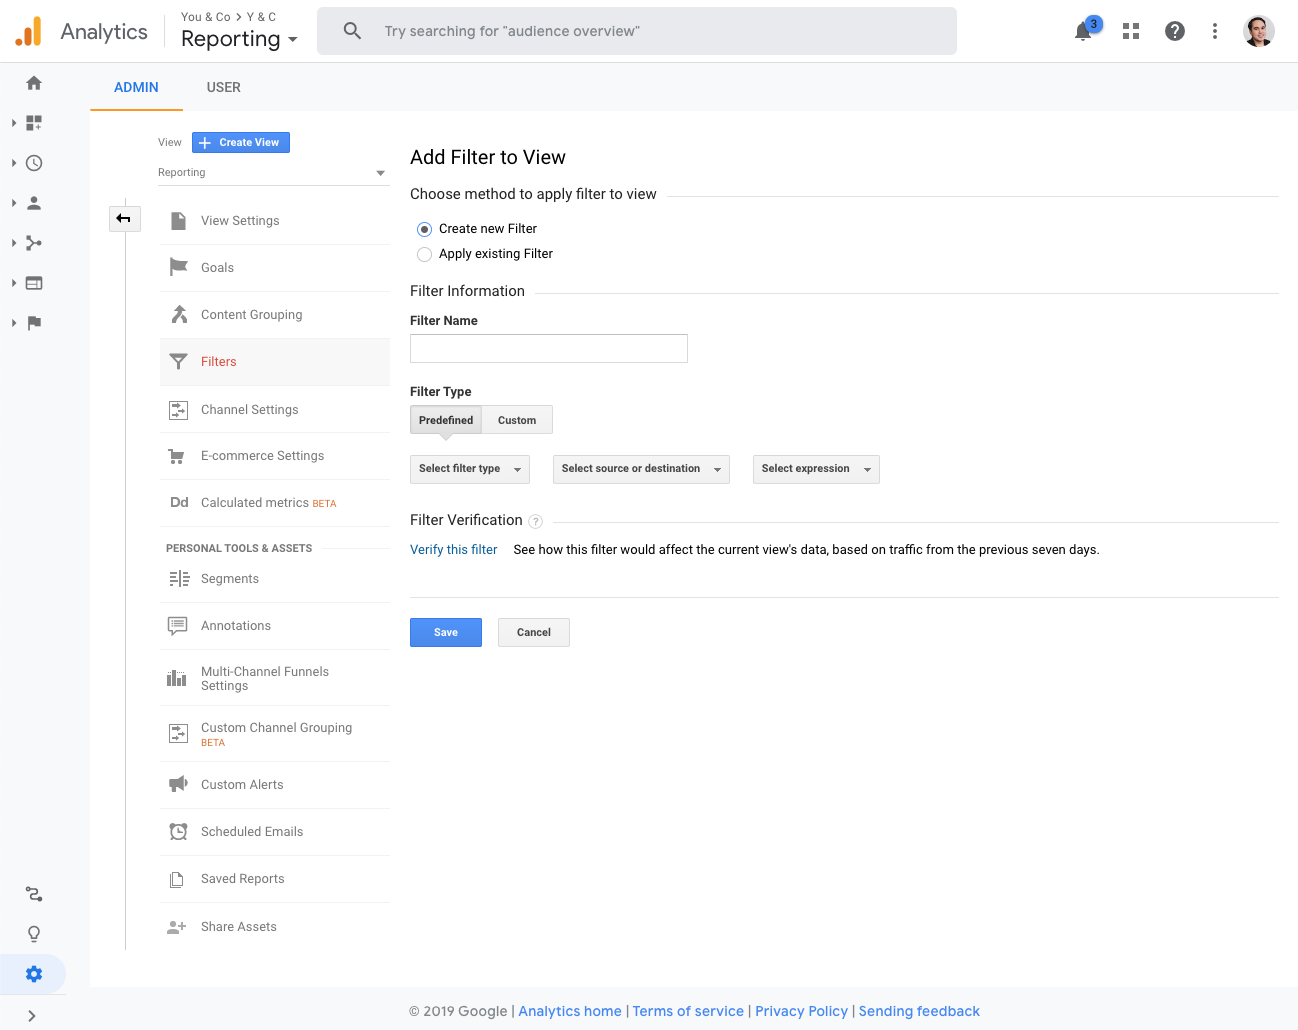
Type in a name to remember, e.g. "Brisbane office", select "Exclude" + "Traffic from the IP Addresses" + "that are equal to" in the drop-downs, then paste in your IP address.
2. Filter out local host
A rare case, but one that may pop up, is that "local host" shows up in your data collection. This is a quick one to check and fix, though often not the one you'd think of.
- Go to Behaviour > Site Content > All Pages
- Select "Secondary Dimension" in the page listing header and find "hostname"
- If you see a hostname that says "local host" or anything that's not your main domain and seems fishy, you're on the right track.
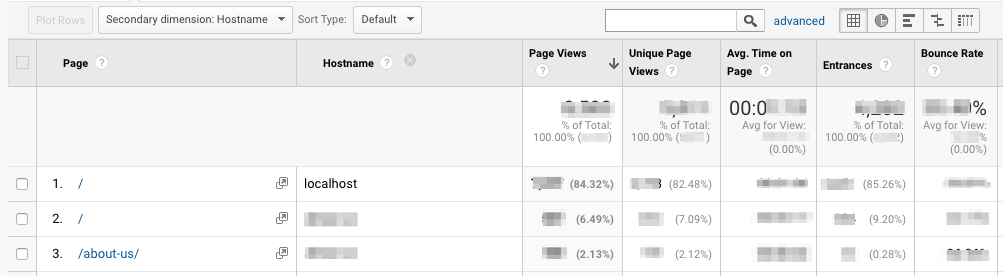
- Follow the same steps as the above IP filtering, but select "traffic to the hostname" under the source/destination dropdown and type "localhost" into the field.
Diagnosis 3: Incorrect goal setup
Now, this one's a bit trickier. Let's say you have a sign-up form you're trying to track and, in the process of putting your GA Goal tracking in place, you've chosen to trigger a goal for people clicking - not completing - the form.
It can happen. More often than not, goal setup is set-and-forget unless you're seeing zeros show up in your report.
So be sure take the time to jump into your GA account every now and then to check your active goals.
Symptoms:
Goal conversions in GA aren't lining up in another tool you have, such as HubSpot or Heap Analytics
How to cure:
- First step is to go through your goal setup. Check all the active goals and review how they're setup. To do this, navigate to Admin > Goals > Click on each active goal.
- If it's a URL destination, make sure that the URL destination is correct.
- If it's an event configuration, this may get more complicated. You're going to want to verify the event by trying to trigger it yourself. You can monitor events by opening up Developer tools (in Google Chrome) by hitting Ctrl Shift J (on Windows) or Ctrl Option J (on Mac).
- Select the "Network" tab in the menu and type "collect" into the filter. What this is, is the network call for when events on the website are sent to GA for collection.
- When you interact with the website, you'll see new collect events added to the bottom. Click through, and in the right pane find the lines "ec", "ea", and "el" in the query string parameter area.
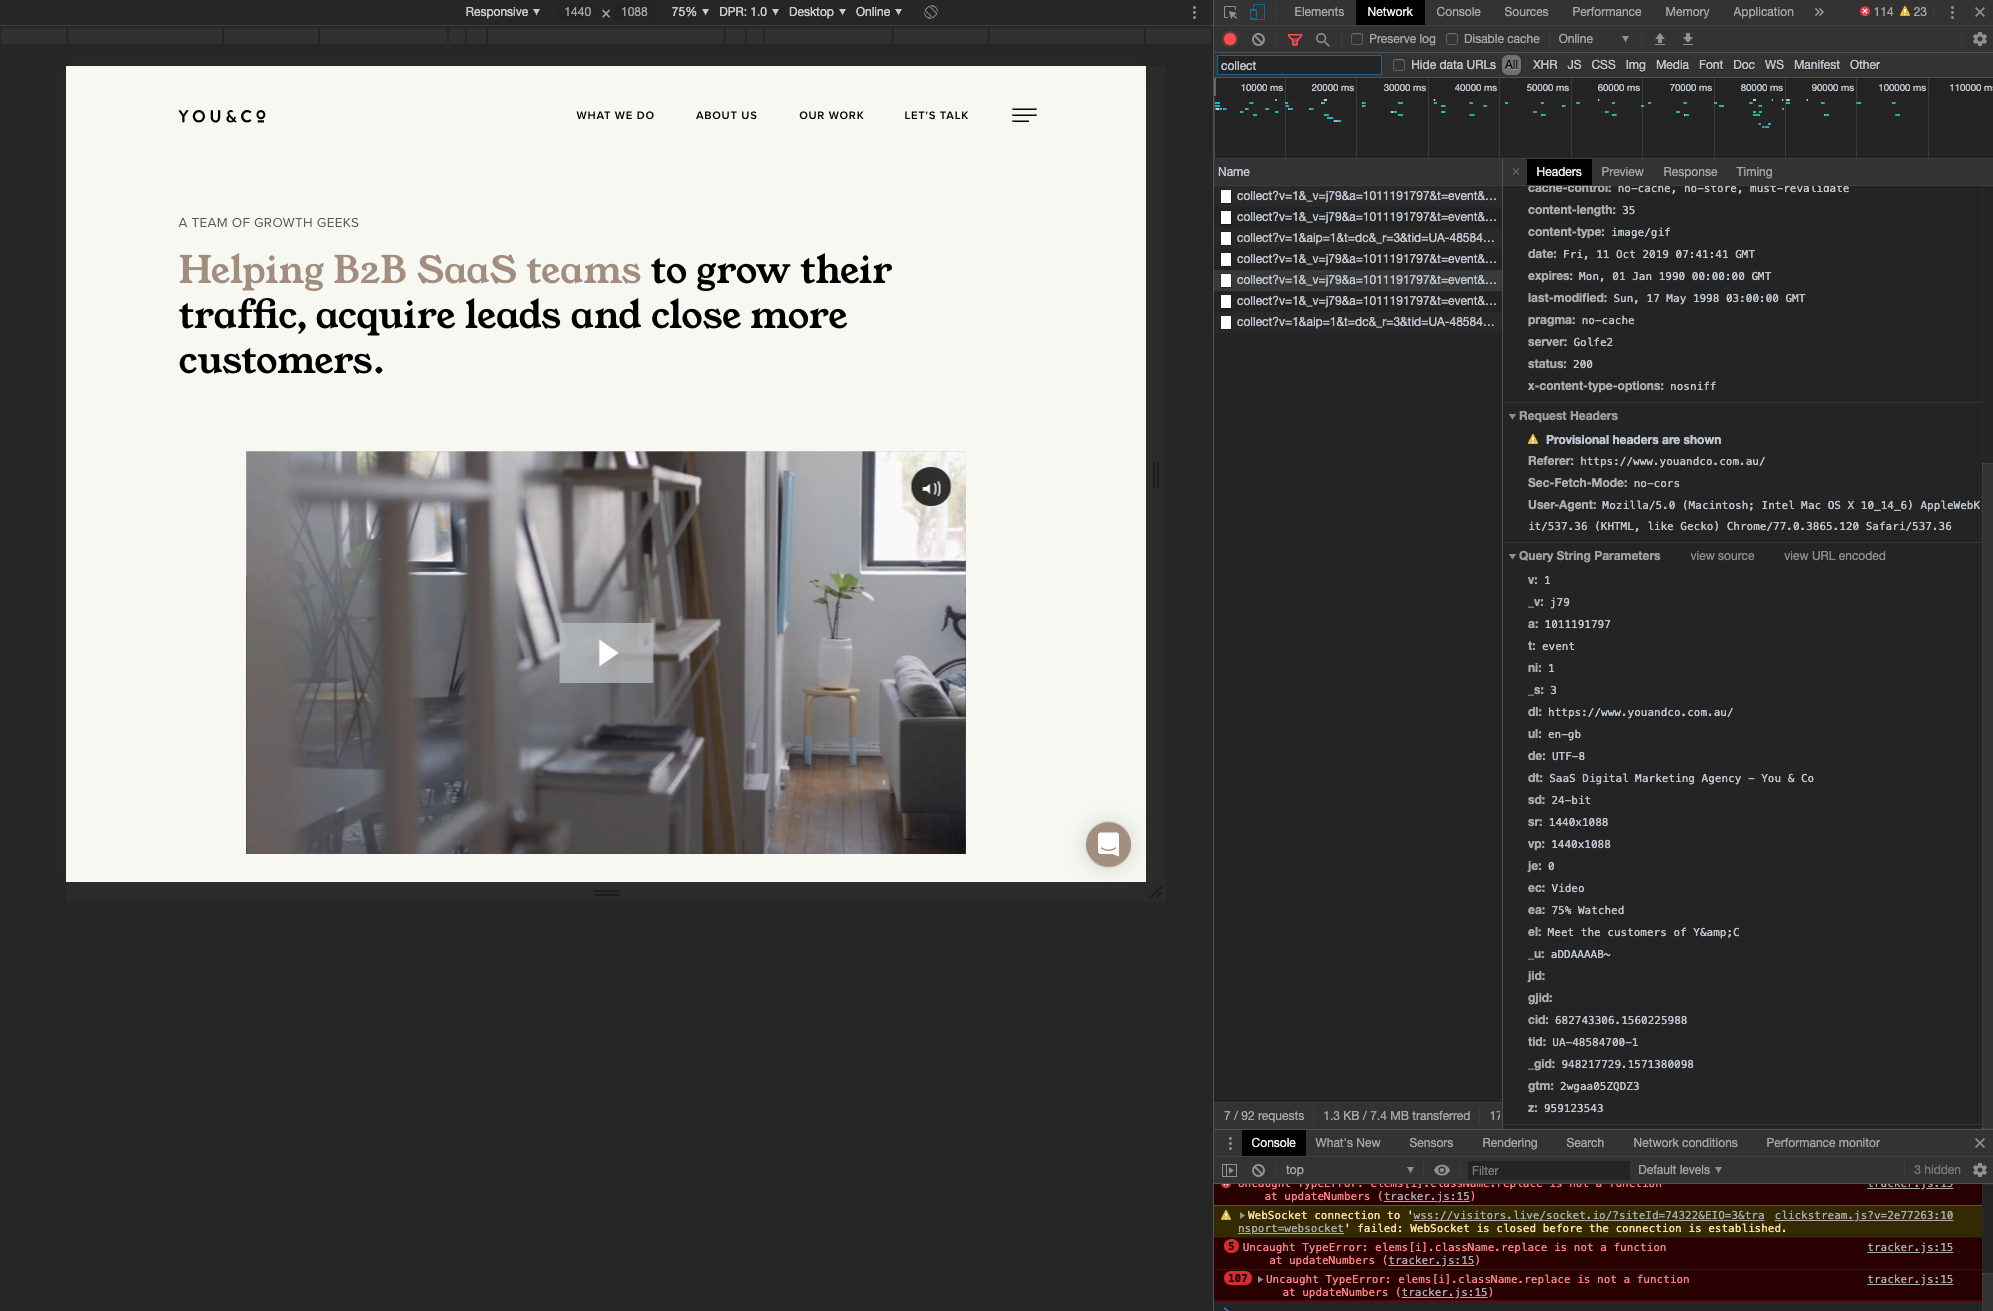
- These should correspond to the event information in the screenshot above. If it matches what and when the goal should be triggering, great! If not, you may need to dive into GTM to fix.
- If you need some help, feel free to hit us up if you're interested in partnering with us to lend a hand to your website.
Final Recommendations
These are the three most common issues that tend to pop up over time with a GA account that isn't regularly monitored or updated, but there are countless things that can cause tracking issues.
If you feel you'd like a group of trained data professionals give your setup a proper look over, don't be shy - reach out to us at YNC! Calling in a professional is always a good move to avoid declaring data bankruptcy.
Any other issues you've seen? Throw us a comment below if you've found more common tracking inconsistencies!